A new industrial plant can meet every production target and still fail its neighbors. Local noise ordinances set limits at the property line, and residents notice a steady hum or whine long before it breaks any rule. On many projects, noise is dealt with after start-up: walls and enclosures are added by trial and error until the complaints stop. That approach is slow and expensive, and it can leave a project exposed to enforcement or legal action until the fix works.
Environmental noise modeling moves that work into the design stage. A model predicts how the plant will sound at the property line and in the surrounding community, then tests noise-control options before anything is purchased or built. This article, adapted from a Memtech Acoustics white paper, explains the two kinds of targets a model can address, what goes into an accurate model, and why the quality of the noise source data decides the quality of the result.
Start with the Target
Before a model can be built, the project team has to decide what it must achieve. There are two very different targets:
- A sound level at a location. Most ordinances and permits set a maximum level at the property line or at a nearby home, usually in dBA or as a day-night average level (Ldn).
- Limiting annoyance. Some owners want to go beyond the legal limit and keep the plant from bothering its neighbors. That calls for a different kind of model.
Predicting Sound Levels at the Property Line
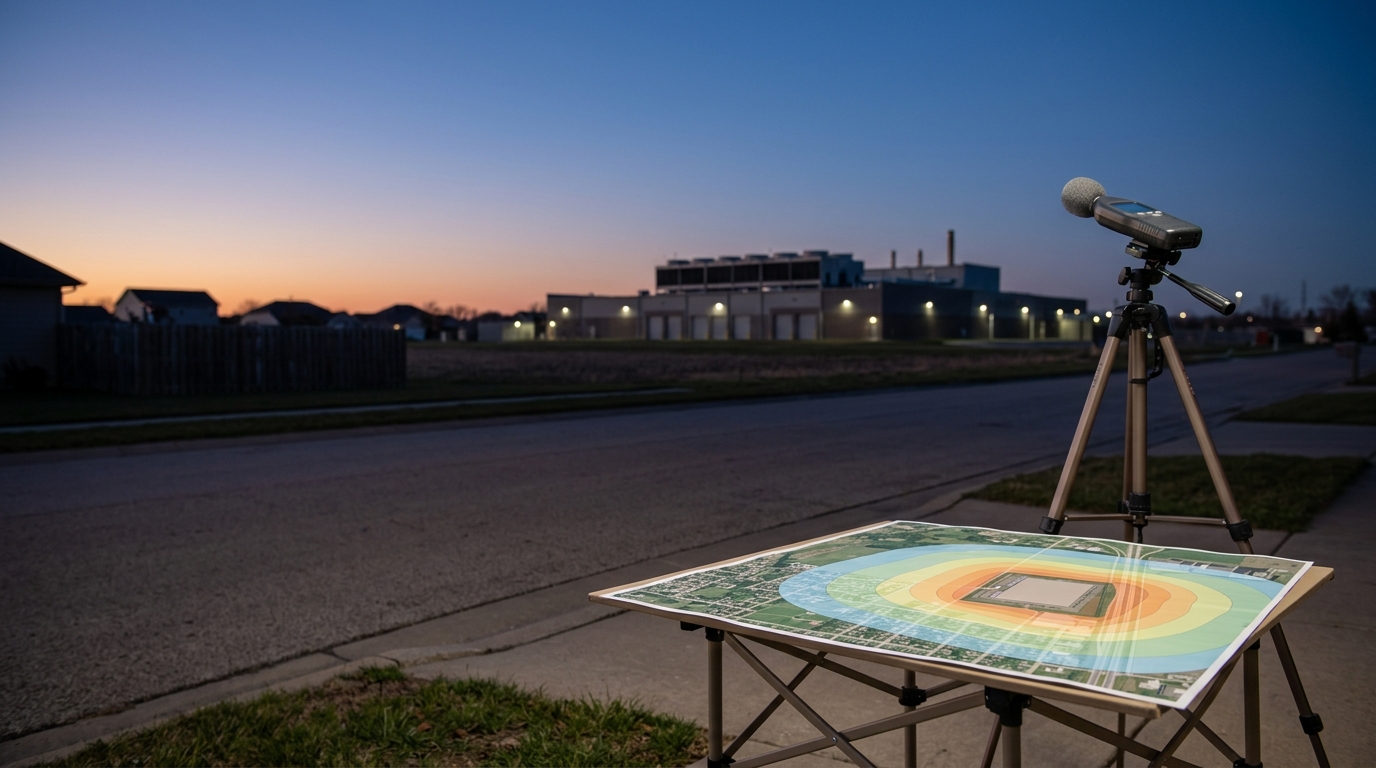
A sound level model starts with the sound power of each noise source, such as each fan, compressor, cooling tower or process skid, and where it sits on the site. It adds the terrain, ground cover, buildings and other structures between the plant and its neighbors, along with the existing background sound. Outdoor sound propagation is calculated with established methods such as ISO 9613, and the predicted levels are mapped as contours around the plant.
Each contour is a band rather than a sharp line, because every prediction carries some uncertainty from the calculation method and from the source data. In a typical Memtech Acoustics model, that band spans about ±2 dBA.
The value of the model is what it lets a team test. Barrier walls, acoustic enclosures, silencers and the equipment layout itself can be changed in the model and compared, so the team can see which combination meets the target at each location before committing to it.
Why Low-Level Tonal Noise Draws Complaints
Meeting a property-line limit does not mean that neighbors will be satisfied. Industrial machinery often produces tonal sound: a steady whine or hum at a distinct pitch, often with harmonics at multiples of that pitch. A tone stands out because it is narrow and constant, while most ambient sound is broadband and changing.
Human hearing locks onto a steady tone. A tone can be audible, and annoying, even when its level is below the overall ambient level, because a broadband background does little to mask a narrow tone. ISO 1996-1, the international standard for describing and assessing environmental noise, recognizes this: it provides adjustments for sounds with tonal, impulsive or low-frequency character.
The setting matters too. Rural areas often have very low ambient levels, so a new source can be noticed at a considerable distance. In urban areas, residents expect traffic and aircraft noise, and those sources change through the day and often drop off at night. The constant, around-the-clock whine of a plant does not, which is why it can draw complaints even where background levels are high.
Predicting Annoyance, Not Just Sound Level
Annoyance is not a fixed quantity. Two people at the same spot can react very differently to the same sound, so an annoyance model works with probabilities rather than a single number.
The model treats the surrounding population as a distribution of sensitivity to noise. At one end are people with significant hearing loss; at the other are people who are bothered by almost any sound. Memtech Acoustics models consider the population within three standard deviations of the average, which leaves out only the extreme cases at either end.

The output is a map of the probability that people within each zone would find the plant noise annoying. A zone marked 0.5 means about half of that population is expected to find it annoying; a zone marked 1.0 means nearly all of them would. These zones usually look very different from the sound level contours for the same plant, which is why a project that checks only property-line levels can still face complaints.
An annoyance model needs more inputs than a sound level model: the frequency content and time pattern of the existing ambient sound, the frequency content and sound power of each source, how people perceive tones and changing sounds, and accurate terrain. It takes longer to build, but it costs far less than retrofitting walls and enclosures after the plant is running. Like a sound level model, it lets the team compare noise-control options before construction starts.
Sound Power vs. Sound Pressure: Getting the Source Data Right
The accuracy of any noise model depends on the source data, and this is where most models go wrong.
Sound power is the total acoustic energy a machine produces. It belongs to the machine and does not change with where the machine is installed. Sound pressure is what a meter reads at a particular spot, and it depends on the distance, the surroundings and any other sound present.
An audio system makes the difference clear. An amplifier rated at 100 watts produces the same power wherever it is used, but the level a listener hears depends on the speakers and the room. The same system might read 90 dBA in a small room and 80 dBA in a larger one, and a room with a lot of background noise would read higher still. Working backward from those readings to the amplifier's real output is difficult. A noise model faces the same problem: sound power is the input it needs, and sound pressure readings are only an indirect route to it.
Many equipment manufacturers do not publish sound power data, because measuring it takes specialized instruments and expertise. It can often be determined in the field. ISO 3744, for example, calculates sound power from sound pressure measurements taken on a surface surrounding the source, although the standard notes that its conditions are impractical for very tall or very long sources and for multi-source industrial plants, where other approaches are needed.
The best input for a model is sound power in 1/3-octave bands for each piece of equipment. When that is not available, 1/3-octave sound pressure readings taken at equal distances around a machine can serve in many cases, provided they are not taken in a reflective room or with high background noise. These measurements must be made methodically by trained staff, and a model built on sound pressure data alone carries wider uncertainty than one built on sound power.
Two shortcuts undermine a model: estimating source levels and frequency content, and relying on sound pressure readings taken under poor conditions or by people without training. Both produce predictions with low confidence. A model is only as good as the data put into it, and the time spent getting accurate source data is what makes the predictions match the plant once it is built.
What a Noise Model Gives the Project Team
- Mitigation sized before construction. Barrier walls, enclosures and silencers are specified from the model instead of being added by trial and error after start-up.
- Layout options compared. Equipment placement and barrier locations can be adjusted until the targets are met at each receiver.
- Cost weighed against benefit. The cost of each option can be compared with the attenuation it delivers, so the budget goes to the measures that do the most.
- Documentation for permits and neighbors. Noise maps and predicted levels support permit applications, planning board reviews and community meetings.
How Memtech Acoustics Can Help
Memtech Acoustics provides environmental noise impact assessments for new and expanding facilities: baseline measurement of existing sound levels, predictive modeling per ISO 1996 and ISO 9613, comparison with the applicable ordinance, and mitigation design. When source data is missing, Memtech Acoustics measures the equipment on site or at the manufacturer's facility. Mitigation is delivered through engineered noise control systems, including barriers, enclosures and silencers.
If you are planning a new plant or an expansion near homes, send Memtech Acoustics the site plan and equipment list. We will tell you what data the model needs and how to get it.